Understanding Statistical Significance: A Comprehensive Guide
Written on
Intuition Behind Statistical Significance
Statistical significance is often a misunderstood concept, particularly in fields like social sciences. This article aims to elucidate common misconceptions about this term and its practical applications.
We will start by exploring how we intuitively perceive and apply statistical significance. Next, we will delve into the scientific principles underlying statistical significance. Finally, we will address the main challenges associated with its usage and propose possible solutions. Let's get started.
Intuitive Understanding of Statistical Significance
People regularly utilize intuitive statistical models. We observe events around us, form hypotheses, and affirm them as truths based on our experiences. While we might not use terms like “statistical” or “significance,” we engage in this process instinctively.
For example, imagine you're driving in a city and come to a stoplight at the town square. Feeling frustrated, you sigh because you anticipate that if this light is red, the next four will likely be red as well. You wish it were green instead.
In this scenario, you've compiled a mental record of past experiences to form an "If-Then" hypothesis. Based on subsequent events—seeing red or green lights—you confirm your hypothesis as true, only questioning it if a significant number of contrary events occur.
In this intuitive framework, any confirming event is deemed statistically significant, thus elevating the importance of your intuitive model. However, several key issues arise here. One major philosophical concern involves understanding the raven paradox. Additionally, the scientific interpretation of statistical significance is markedly different from our intuitive understanding.
Scientific Framework of Statistical Significance
When it comes to scientific methods, intuition often takes a backseat. Ronald Aylmer Fisher was a pioneer in modern statistical methods, which can be summarized in a series of steps:
- Establish the null hypothesis.
- Conduct an experiment and gather data.
- Calculate the probability of observing results that are exceptions to the null hypothesis, assuming it is true. This probability is known as the p-value.
- If the p-value falls below a certain threshold (often 5%, Fisher's preference), the results reject the null hypothesis, indicating statistical significance. If it is above the threshold, the null hypothesis remains unchallenged.
The initial step of framing the null hypothesis highlights a crucial difference between intuitive and scientific statistical significance. In intuitive models, confirming events are marked as statistically significant. In contrast, scientific methods require that the data be sufficiently inconsistent with the null hypothesis to achieve statistical significance.
For clarity, consider this example: Suppose I claim I can make the sun rise in the east. Your intuitive model might suggest that observing sunrises provides statistical significance to my claim. However, under scientific scrutiny, the null hypothesis would be that I do not have this power. To test this, you might ask me not to cause the sunrise. If the sun rises anyway, the null hypothesis holds.
Practical Application Example
Imagine you're testing a cream designed to protect against radio waves. Your hypothesis is that the cream will provide significant shielding. The corresponding null hypothesis states that the cream has no effect.
In your experiment with 100 participants—50 using the cream and 50 using a placebo—you measure the shielding effectiveness for all subjects. It is not enough for the cream users to show better results. There must also be a minimal number of placebo users with comparable results, supported by the p-value. If these conditions are met, the results are deemed statistically significant, leading to the rejection of the null hypothesis.
While this example simplifies many complexities, it effectively illustrates the scientific approach to null-hypothesis significance testing introduced by Fisher.
Challenges Associated with Statistical Significance
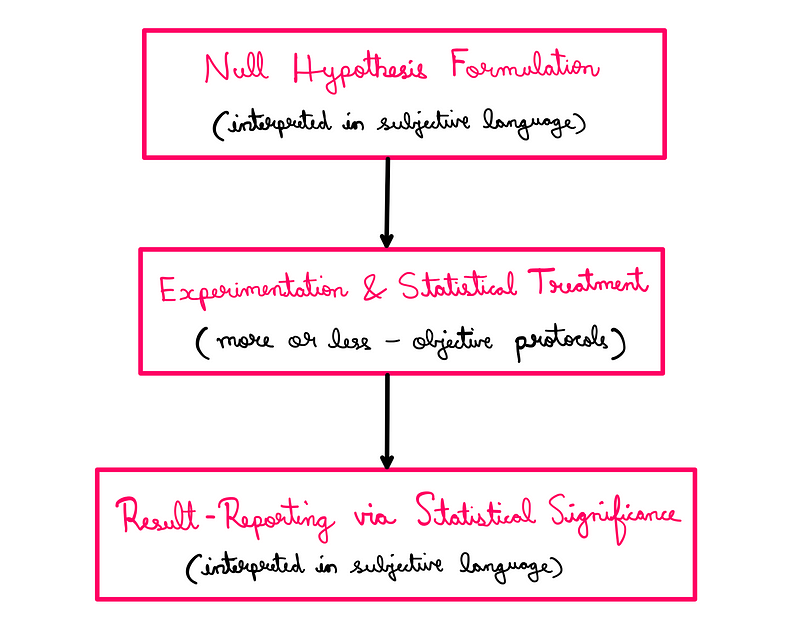
Many issues arise at what I refer to as interface points. A typical statistical workflow is as follows:

This flowchart outlines the objective protocols for experimentation and statistical analysis. However, problems often surface during the formulation of the null hypothesis and the interpretation of results.
First Interface Point
The first interface point arises from our interpretation of the null hypothesis, which is often assumed to be false. In reality, every application typically yields a binary outcome: it either has an effect or it does not. The notion of zero effect might exist only when the impact is negligible. This flawed formulation can lead to erroneous conclusions.
Second Interface Point
The second interface point occurs during the interpretation of statistical results. Statistical significance merely indicates an effect; it does not address the significance or importance of the findings. It is crucial for us to draw conclusions carefully.
For instance, if I claim that the cream improves shielding by a factor of ten, it sounds impressive. Yet, if the baseline shielding without the cream is an extremely small number, the improvement might not be as substantial as it appears.
Addressing Issues with Statistical Significance
To tackle the challenges presented, we must first focus on the interface points. There is no one-size-fits-all solution. When confronted with "statistically significant" results, we should critically evaluate the null hypothesis formulation and the interpretation of significance.
While statistical methods may also present issues, the interface points often evoke emotional responses, leading to misinterpretation. For example, an alarming conclusion could prompt an unnecessary reaction, even if the underlying numbers are minimal.
Ultimately, the term "statistical significance" does not convey the quantitative importance of findings. It simply indicates that we are observing something noteworthy.
Reference and credit: Jordon Ellenberg.
Further reading that might interest you: How To Perfectly Predict Improbable Events? and The New Industrial Revolution Is Here.
If you would like to support me as an author, consider contributing on Patreon.
Understanding Statistical Significance: The Video Insights
The first video titled "Understanding Statistical Significance - Statistics help - YouTube" provides a thorough overview of statistical significance in a practical context.
The second video, "Statistical Significance and p-Values Explained Intuitively - YouTube," offers an intuitive explanation of p-values and their relevance to statistical significance.