Understanding Spectral Graph Theory: A Comprehensive Guide
Written on
Chapter 1: Introduction to Spectral Graph Theory
Spectral graph theory represents a fascinating area within mathematics that examines the characteristics of graphs through the lens of eigenvalues and eigenvectors derived from associated matrices, specifically the adjacency and Laplacian matrices. In simple terms, a graph consists of vertices (or nodes) linked together by edges.
Graphs serve as essential frameworks for representing complex systems, including social networks, biological networks, and communication systems. By studying the underlying structure of these networks through graph theory, researchers can uncover insights into their properties, behaviors, and develop predictive models to influence their dynamics.
A pivotal concept in spectral graph theory is the Laplacian matrix, which captures the structural information of a graph. This matrix can be utilized to investigate several attributes of the graph, including connectivity, clustering tendencies, and spectral gaps.
In this article, we aim to introduce spectral graph theory to readers with a solid foundation in college-level mathematics but who may not be experts in the field. We will clarify essential terms and concepts, outline the characteristics of Laplacian matrices, explain algorithms pertinent to spectral graph theory, and explore its applications across various disciplines.
Section 1.1: Fundamental Concepts
Before we dive deeper into spectral graph theory, it is crucial to understand some fundamental concepts.
A graph can be defined as a collection of vertices or nodes that are interconnected by edges. These structures can effectively model various intricate systems, such as social interactions, transport routes, and biological networks.
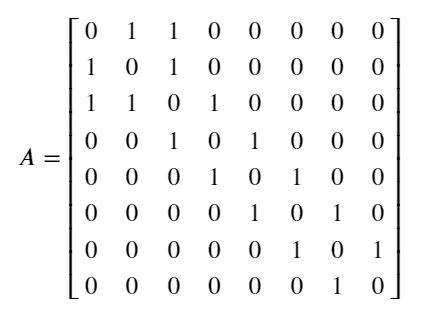
The adjacency matrix is a crucial element that represents the connections between vertices in a graph. In this matrix, a value of 1 indicates the presence of an edge between two vertices, while a value of 0 signifies no connection.
For instance, consider the following graph:
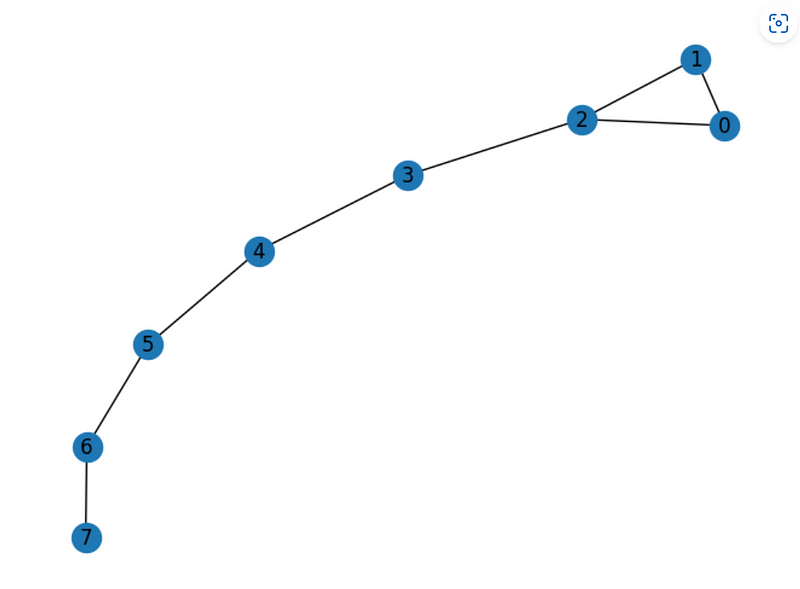
The adjacency matrix corresponding to this graph would be:
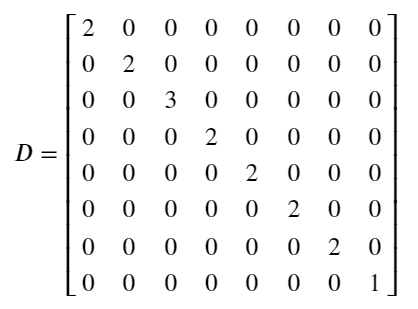
The degree of a vertex refers to the number of edges incident to it. The degree matrix is a diagonal matrix that encapsulates the degrees of the vertices within a graph. In this matrix, each diagonal element represents the degree of a corresponding vertex.
For example, the degree matrix for the above graph is:
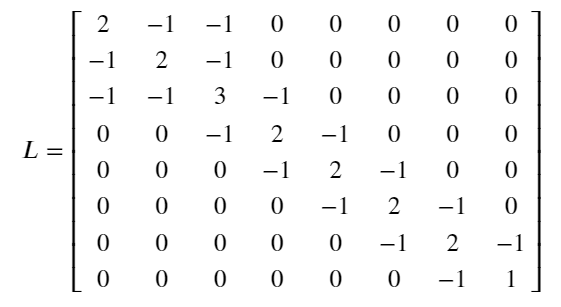
The Laplacian matrix is defined as the result of subtracting the adjacency matrix from the degree matrix. This matrix is symmetric and positive semi-definite, encapsulating the graph's connectivity.
For the aforementioned graph, the Laplacian matrix is:
The eigenvalues and eigenvectors of the Laplacian matrix provide valuable insights into the graph's properties. Notably, the smallest eigenvalue is always 0, associated with an eigenvector of all ones, representing the overall connectivity. The second-smallest eigenvalue, known as the algebraic connectivity or Fiedler value, offers a measure of the graph's connectivity. A smaller algebraic connectivity implies a greater ease of dividing the graph into disconnected components, while a larger value indicates robustness against perturbations.
The eigenvectors of the Laplacian matrix are instrumental in executing spectral clustering, a method for dividing graph vertices into groups based on their connectivity. This process entails computing the eigenvectors of the Laplacian matrix, subsequently projecting the vertices into a lower-dimensional space for partitioning based on their positions.
Section 1.2: Algorithms in Spectral Graph Theory
Several algorithms within spectral graph theory facilitate the analysis of graph properties and networks, leveraging the eigenvalues and eigenvectors of the Laplacian matrix to tackle various optimization challenges, including graph partitioning and clustering.
One notable algorithm is spectral partitioning, which aims to divide the vertices of a graph into two distinct subsets by identifying the cut that minimizes the sum of the weights of edges spanning the cut. This task can be framed as a quadratic optimization problem solvable through the eigenvectors of the Laplacian matrix.
The procedural steps for spectral partitioning include:
- Compute the Laplacian matrix of the graph.
- Calculate the eigenvectors corresponding to the smallest eigenvalues of the Laplacian matrix. These eigenvectors define the subspace linked to the "smallest cuts" in the graph.
- Project the vertices onto the subspace represented by these eigenvectors.
- Partition the vertices based on their positions in this subspace.
The resulting partition effectively minimizes the number of edges crossing the cut, making spectral partitioning a potent method for tasks such as graph partitioning, clustering, and community detection.
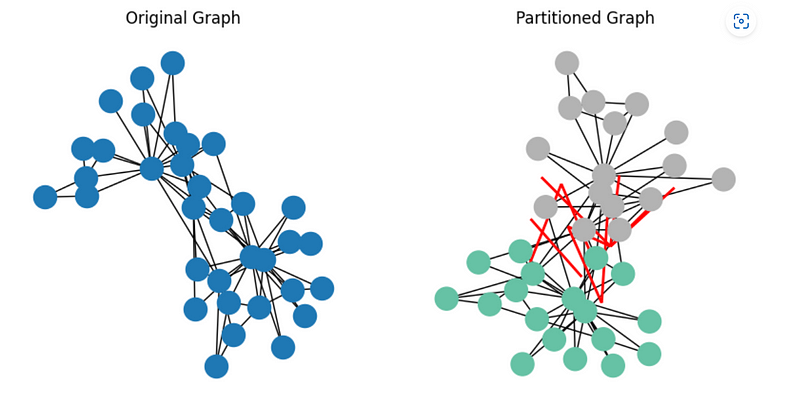
The plot illustrates the outcomes of spectral partitioning applied to an example graph, specifically Zachary's Karate Club graph. The original graph appears in the left subplot, while the right subplot displays the partitioned version.
In the partitioned graph, nodes are color-coded according to their respective partitions, with different colors indicating different groups. The red-highlighted cut reflects the edges separating the partitions, successfully segmenting the graph into two distinct subsets, each representing a unique community from the original graph.
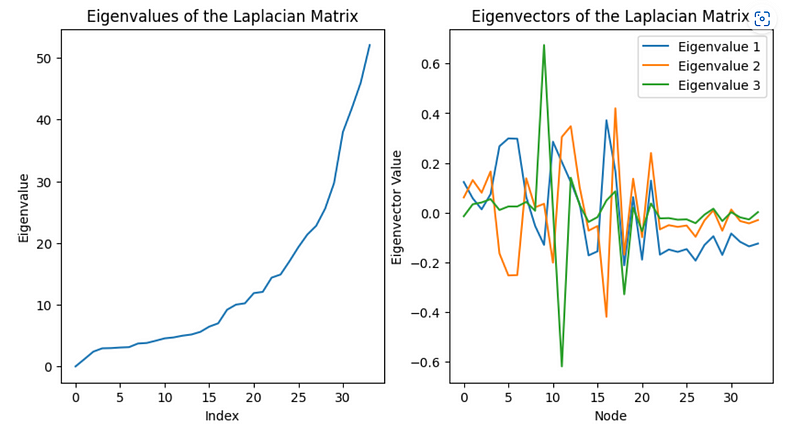
The first plot showcases the eigenvalues of the Laplacian matrix, arranged in ascending order. The initial eigenvalue is always zero, corresponding to a trivial eigenvector with a constant value across all nodes. The remaining eigenvalues are positive and represent non-trivial eigenvectors that capture the graph's connectivity structure. Notably, the gap between the first eigenvalue and subsequent ones can indicate the number of connected components present in the graph.
The second plot displays the values of the first three non-trivial eigenvectors of the Laplacian matrix for each node. Each eigenvector is represented with distinct colors in the plot. The first eigenvector encapsulates the graph's overall structure, while the second eigenvector reveals the division between two communities, and the third eigenvector highlights more subtle structures.
Conclusion
This article has introduced the fundamentals of spectral graph theory, a mathematical domain focused on understanding graph properties through eigenvalues and eigenvectors of associated matrices. We have defined key terms and concepts, elaborated on the characteristics of Laplacian matrices, and outlined algorithms employed in this field. Spectral graph theory is a significant and intriguing area of mathematics with numerous potential applications, and we hope this article provides a valuable overview of this captivating subject.