Exploring Nvidia's Future: Could NVDA Surpass $714?
Written on
Chapter 1: Nvidia's Remarkable Growth
Nvidia, a leader in graphics and networking solutions, has experienced extraordinary growth, propelling its stock price to new heights. As of November 24, the stock soared 227% from $146.14 at the end of 2022 to $477.76.
Despite analysts' mixed forecasts, AnaChart, a new market tracking service, highlights some analysts' successes.

However, following the latest quarterly results that exceeded expectations, the stock has seen a downturn. This situation raises important questions regarding NVDA's true value and the accuracy of analysts' valuations.
Section 1.1: Nvidia's Exceptional Q3 Performance
On November 21, Nvidia announced fiscal Q3 results that surpassed revenue projections of approximately $16 billion, achieving $18.12 billion instead. Additionally, free cash flow (FCF) rose to $7.042 billion, up from $6.048 billion in the previous quarter.
Free cash flow is a crucial metric as it reflects the cash generated by the company after deducting all operating expenses, including capital expenditures and changes in working capital. During the last quarter alone, Nvidia generated over $7 billion in FCF, totaling over $15.7 billion in the past nine months.

FCF accounted for over 38% of the last quarter's revenue and more than 40% over the last nine months, indicating strong potential for future growth. Analysts are now projecting next year's revenue could exceed $88 billion, with an average forecast of $88.25 billion for the year ending January 31, 2025.
Why the extended forecast? The market evaluates companies based on future expectations. Assuming Nvidia maintains a 40% FCF margin, next year's FCF could surpass $35 billion, which can be instrumental in assessing NVDA's stock value.
Section 1.2: Valuation Insights: NVDA's Potential Worth
Analysts often employ a valuation method known as FCF yield, akin to dividend yield, but uses FCF estimates instead. If Nvidia's projected FCF of $35.3 billion is divided by a 2% yield, this suggests an implied market value of $1.765 trillion.
Currently, NVDA's market cap stands at $1.18 trillion, indicating a potential increase of 49.6%. This means NVDA stock could be valued at nearly $714 per share, representing a significant upside despite recent declines.

This projection signifies a potential gain of $236.97, even in light of recent stock sell-offs.
Chapter 2: Analyst Performance and Predictions
But have analysts accurately predicted Nvidia's trajectory? Unfortunately, the answer is largely no. The average analyst forecast suggests only an upside of $40.59, significantly below the potential $236.97 upside indicated by our analysis.
This suggests that many analysts may not have correctly assessed the stock's value. AnaChart reveals that only a select few analysts have consistently provided accurate predictions.
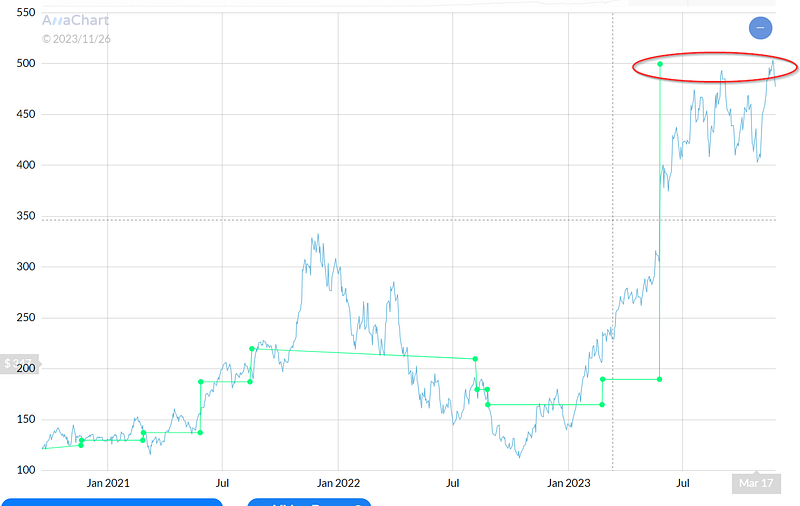
One standout is Richard Shannon from Craig Hallum, whose average prediction period is just 42 days. His recent target of $500 has already been surpassed by NVDA.

In conclusion, while some analysts have made accurate predictions, many have fallen short. The insights from AnaChart can guide investors in identifying which analysts to trust for future stock evaluations.
This article does not constitute financial advice, and readers should conduct their own research before making investment decisions.
If you appreciated this content, please engage with a comment or a like. Your feedback is valuable!